
- The US Dollar snaps below first important support .
- Markets are selling the Greenback on weaker Retail Sales.
- The US Dollar Index could dip to 104 before finding ample support.
The US Dollar (USD) is accelerating the trimming of its weekly gains, which got booked on Tuesday in the aftermath of the red hot inflation report. Several analysts and economists were quick to write off the report as a one-off, with even US Federal Reserve member Austan Goolsbee saying that markets should not take into account only this Consumer Price Index (CPI) number. The disinflationary pathway to rate cuts is still very much intact and a cut is on the horizon.
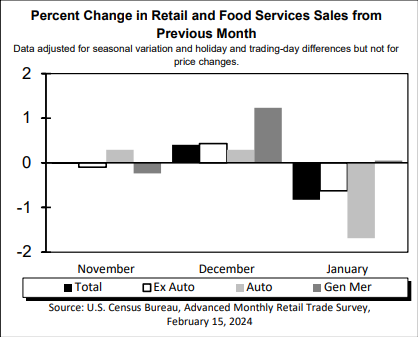
Full Retail Sales Report: https://www.census.gov/retail/marts/www/marts_current.pdf
On the economic data front, Retail Sales is confirming what US Fed member Austan Goolsbee said when it comes to the whole picture of the US economy. The US inflation print on Tuesday was a bit of an outlier, while the disinflationary path is still ongoing. The decline in Retail Sales is matching that idea.
Following repricing by market participants regarding the timing and amount of rate cuts in 2024, time will tell if this will be the new norm. Personally i expect the back and forth on rate hike expectations to continue while the fight againts inflation may throw up a few more surprises as tensions in the middle East continue to simmer.
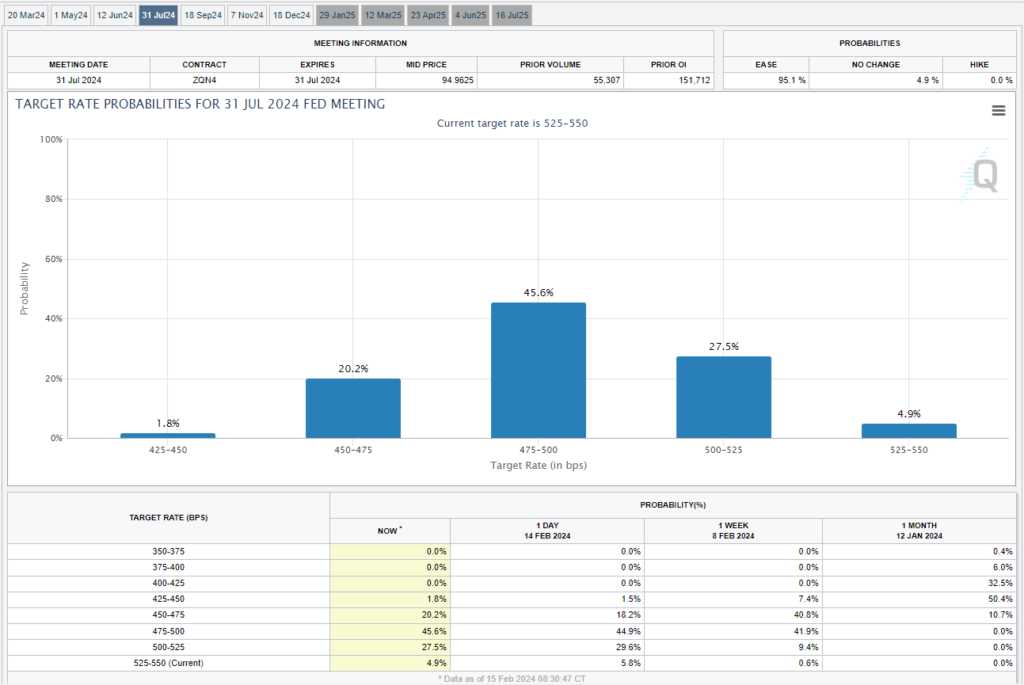
Source: CME FedWatch Tool
US Dollar Outlook
The US Dollar Index (DXY) is now fully stalling ahead of even a doubtful attempt to reach 105. Traders will need to learn to live with these kinds of small and short-lived moments of volatility until finally one of the big four central banks (Fed, ECB, BoE, BoJ) makes a move with either cutting or hiking. Expect to see a fading DXY, which could fall back to 104 or lower in search of support.
Should the US Dollar jump on the back of this Thursday’s data to 105.00, 105.12 as key levels to keep an eye on. One step beyond there comes in at 105.88, the high of November 2023. Ultimately, 107.20 – the high of 2023 – could even come back into scope, but that would be when several inflation measures are coming in higher than expected for several weeks in a row.
Support should now be provided by the high of last week Monday near 104.59. Further down that 100-day Simple Moving Average looks rather doubtful, near 104.24, so the 200-day SMA near 103.67 looks more solid. Should that give way, look for support from the 55-day SMA near 103.08.
Dollar Index Daily Chart
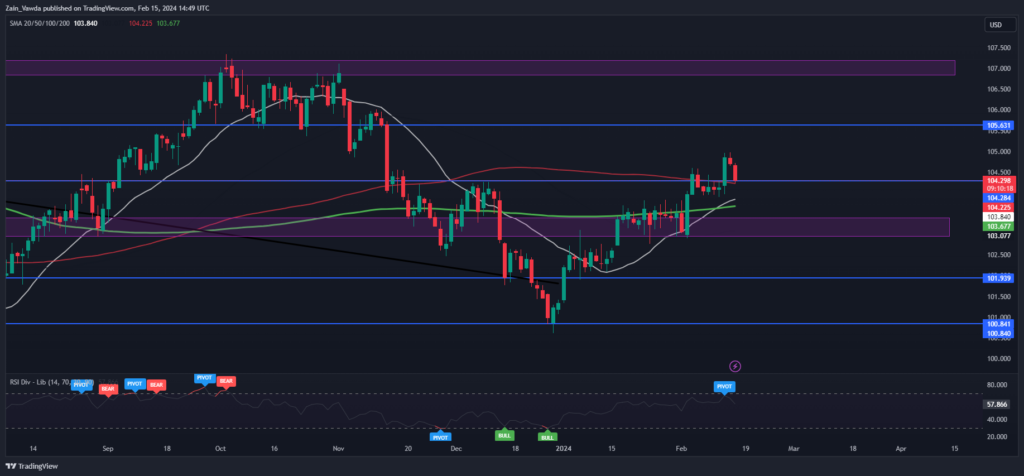
Source: TradingView, Prepared by Zain Vawda
Article sources: FXStreet, CME FEDWATCH TOOL, PIQ Suite


