
Gold price returned to the red zone on Thursday, snapping Wednesday’s temporary reversal, as a resurgent demand for the US dollar weighed on the bullion. Investors shrugged off the concerns over the new Omicron covid variant, as the risk sentiment improved and reduced the appeal for US Treasuries, prompting a rebound in the Treasury yields across the curve. The benchmark 10-year US rates rebounded from over two-month lows of $1.40, diminishing the attractiveness of the non-yielding gold. Further, the Fed’s hawkish tilt, as the officials hinted at speeding up tapering, continued to temper the sentiment around gold price. Wall Street indices staged a solid comeback from the previous slump induced by an Omicron covid case detected in California.
Gold price is attempting a last dance ahead of Friday’s critical US Nonfarm Payrolls data, which is likely to show that the economy added 550K jobs in November when compared to October’s +531K. Apart from the US jobs data, the Markit and ISM Services PMI will also offer some trading incentives. The labor market report could cement an increased pace of tapering at the December FOMC decision, which may trigger a brief US dollar rally. As a result, gold price could breach the key support of around $1,760 to test the next psychological cushion at $1,750. However, if the market sentiment worsens on intensifying Omicron covid concerns, then gold price could find some support from the risk-off flows-driven renewed weakness in the yields.
For more trading tools, real time data and technical analysis visit us https://lotusacademy.africa/
Gold Price Chart – Technical outlook
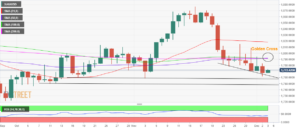
The call for a potential reversal in the ongoing downtrend remains intact, especially after a golden cross was confirmed on Wednesday. The 50-Daily Moving Average (DMA) crossed the 200-DMA for the upside on a daily closing basis, flashing a bullish signal.
Although gold price will likely remain at the mercy of the US NFP outcome and the risk tone on the final trading day of the week.
The 14-day Relative Strength Index (RSI) is inching higher but well below the midline, suggesting that any rebound in the price could be shallow.
On the upside, the confluence of the 50, 100 and 200-DMAs at $1,792 needs to be cracked to initiate a meaningful recovery from monthly lows. The next upside target is seen at the $1,800 mark.
The further recovery could call for a retest of Wednesday’s high at $1,809, above which the previous month’s high at $1,814 will put to test. The mildly bearish 21-DMA at $1818 will be the level to beat for gold bulls.
On the downside, a sustained break below the falling trendline support at $1,763, will seek a test of the November 3 low of $1,759.
Further south, the $1,750 psychological level will challenge the bullish commitments. A sharp sell-off towards September lows of $1,722 will be in the offing should the latter give way.
SOURCES: FXSTREET


