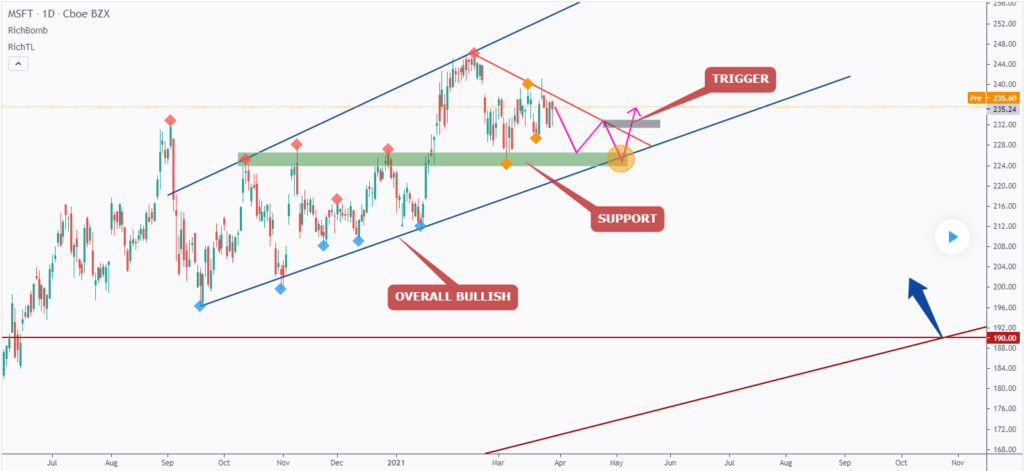
I found the MICROSOFT chart interesting.
We can see that MICROSOFT is currently trading inside these two blue trendlines forming a rising channel .
And it is currently approaching a strong rejection/ support area .
I call it “War Zone”, highlighted in Orange (circle).
The highlighted orange circle is a strong area to look for buy setups as it is the intersection of support in green and the lower blue trendline acting as non-horizontal support. (trend-following setup)
As per my trading style/plan:
Short-term: As MICROSOFT approaches the orange circle (area), I will be looking for bullish reversal setups on lower timeframes (like a double bottom , trendline break , and so on…)
Long-term: I will be waiting for a third swing high to form around the upper red trendline (projection in purple) for it to become valid then buy on this last swing high (gray area) break upward.


