Silver struggled to capitalize on the previous day’s positive move and edged lower on Tuesday.
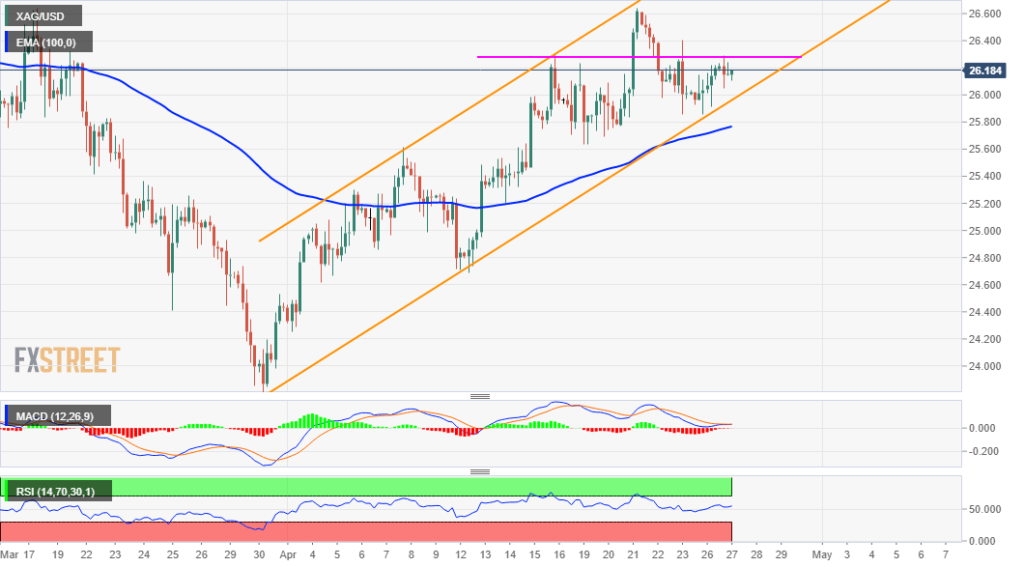
The formation of a bearish flag chart pattern supports prospects for further near-term weakness.
Bullish technical indicators warrant some caution before positioning for any meaningful downside.
Silver traded with a mild negative bias through the early European session, albeit has still managed to hold its neck above the $26.00 mark. The white metal was last seen hovering around the $26.15- 20 region, down 0.15% for the day.
Looking at the technical picture, the XAG/USD, so far, has struggled to capitalize on the overnight bounce from the vicinity of the $25.75-70 confluence support. The mentioned region comprises 100-period EMA on the 4-hour chart and the lower boundary of a near four-week-old ascending channel. This should now act as a key pivotal point for short-term traders.
Meanwhile, technical indicators on the daily chart maintained their bullish bias and have again started moving into the positive territory on hourly charts. This supports prospects for additional near-term gains. That said, the technical set-up remains tilted in favour of bearish traders and warrants caution before positioning for any further appreciating move.
Given the recent sharp pullback from the key $30.00 psychological mark, the upward sloping channel constitutes the formation of a bearish flag chart pattern. Hence, any subsequent positive move is more likely to confront stiff resistance near the $26.60-65 supply zone. This, in turn, should cap the XAG/USD near the trend-channel barrier, currently near the $27 mark.
A sustained move beyond will mark a bullish breakout and negate any near-term bearish outlook. The subsequent short-covering move has the potential to lift the XAG/USD further towards the $27.65-70 resistance zone.
On the flip side, the $25.75-70 region might continue to protect the immediate downside. A convincing break below might now turn the XAG/USD vulnerable to accelerate the fall towards the key $25.00 psychological mark en-route the $24.65-60 horizontal support. Some follow-through selling would allow bearish traders to challenge the $24.00 mark.
The downward trajectory could further get extended back towards YTD lows, around the $23.80-75 region touched on March 31, en-route the $23.20 support zone.


